Reflections on Addis Ababa, Urbanization and Globalization

Splatter Compass

20140722_093946

I’m currently back in Addis Ababa after teaching in Gondar and visiting Bahir Dar. After spending about 2 weeks here in Ethiopia, here are some of my thoughts (or some brainstorming for future research) in my last 24 hrs here in Ethiopia.

When I first read Mike Davis’s Planet of Slums in graduate school in 2007, I noticed a table using United Nations data that suggested at 99.4% of Ethiopia’s urban population resided in “slums.” In comparison, neighboring Sudan had 85.7%. Another point of comparison for my friends who are reading this blog entry, Turkey had a 42.6% slum population. At the time, I couldn’t help but think that the percentage for Ethiopia made no sense, unless one is only using very Western definitions of urbanization and slums. Informal settlement would be a better term. This is why AbdouMaliq Simone in his introduction to Urban Africa discusses the importance of  local social practice and organization as the lens to use when examining cities in Africa. If one uses terms such as percent urbanized a great deal of nuance is overlooked. For example, according to the World Bank, Ethiopia’s urban population had only grown from 15% in 2000 to 18% (of ~91.7 million) in 2013. Addis Ababa represents about half that percentage. Similarly, according to the World Bank the percent of Ethiopia’s urban population in the same time period with improved sanitation only improved from 22% to 27%. In other words, there appears to not have been a great deal of “urbanization” or “development” is taking place given those numbers.

However, there have been dramatic urban transformations in recent years. For instance, Wendel Cox at New Geography has looked that the evolving urban form of Addis Ababa. There clearly is urbanization taking place. There are unavoidable new construction projects in many areas of the city, especially around Bole. Streets are torn up for Chinese backed transit projects such as a new boulevard in commemoration of the African Union’s 50th anniversary in 2013 and a massive (elevated) light rail project projected to open in 2015. The Chinese Communications Construction Company was given a 1.5 billion dollar contract for the light rail project. More recently a Turkish firm was given a major road construction contract. In other words, there’s a massive transformation going on that is re-shaping the city. It’s not uncommon to see “shacks” adjacent to new buildings. I’ve seen several vacated communities of shacks made of earth, corrugated steel, and other materials next to new development of multi-story concrete apartment buildings as one travels from Bole to the old Piazza area of Addis. 

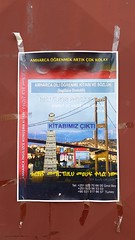
There’s a very interesting story regarding globalization and urbanization here to be told (or will be unfolding), since outside of Bole, there isn’t a strong (Western) multinational corporation presence in the visual urban landscape. However, behind the scenes, in the periphery, factories by Chinese and Turkish firms are being built. Billboards for Arçelik appliances in English, or a Turkish restaurant with Ethiopian staff blasting American hip-hop, as well as authentic Chinese banquet hall style restaurants and shoe shine boys have greeting me in Mandarin reveal an amazing social-cultural tapestry (amidst the extreme inequality) as well as the dynamics of the so-called South-South economic expansion. 

Summer Travels and Teaching Overseas

PassportLast summer I taught at Boğaziçi University in Istanbul, Turkey and this summer I’ll be headed to the University of Gondar in Ethiopia. As I get ready for departure, I want to do a blog post on teaching overseas.

Although, I cringe when people call me a “teacher” (since I’m a researcher as well), teaching is very important to me. I enjoy being at a teaching oriented institution. However, I’m often jealous of friends and colleagues at research institutions who have resources and schedules that make going abroad easier. In the absence of those resources, teaching overseas during the summer is a great opportunity to both develop myself as a teacher and conduct research. Importantly, working with students overseas makes me something other than a tourist. While, I don’t horribly mind being a tourist (sometimes), being one certainly limits you. As a social scientist, it’s important to have first hand knowledge that isn’t filtered through pre-packaged vacations. I don’t want to just visit places, I want to get to know as much about a society as possible.

I teach and write on globalization and cities, as such, being able to live and work in other parts of the world (even if briefly) is vital to my intellectual and professional growth. As Donald Hall writes in the Chronicle of Higher Education, the benefits of teaching abroad include “important pedagogical, research-related, and life lessons.” It allows me to bring experiences back into the classroom and it informs my research writing. Overseas teaching not only gives me intimate knowledge of places and people, but forces me to critically think about the material I teach or write about.

From the standpoint of research, I was able to meet with colleagues (old and new) to share ideas last summer in Istanbul. I also learned a great deal from my students. My time there led to two article manuscripts and a new perspective on the city’s dramatic growth since my first visit in 2006 (and subsequent visits in 2008 and 2011). Perhaps most interesting was being able to teach an environmental sociology course amidst the Gezi Park protests in Istanbul.

This summer, I’ll be visiting Ethiopia for the first time. This trip will greatly support my ongoing work on global urban development issues. While most of my time will be in Gondar, I’m looking forward to seeing Addis Ababa. As an urbanist, it’s always interesting to see different types of cities. I’m hoping to learn about the city and the country, as well as examine the connections that shape different types of urbanism around the world.

Follow my trip via this blog and my twitter account.

Prepping for Fall 2014: Visualizing School Closures

Splatter Compass

compassIn my previous post, I mentioned that I spend a lot of time during the summer prepping for academic year. This fall requires extra work because I’m changing textbooks, and re-organizing a lot of material. I’m not doing this just to improve the content or my teaching, but I do this to “exercise” my other skills – things like playing with Google Fusion Tables, Photoshop, HTML, etc.

This fall I’ll be teaching urban sociology again and I’m currently updating material for the course. New on the syllabus for this year is Robert Sampson’s book on Great American City: Chicago and the Enduring Neighborhood Effect. Reading the book the past few weeks inspired me to think of examples to help students make comparisons/connections between Chicago and Philadelphia.

Perhaps the most obvious example is that were both hit bad with school closures in 2013 affected whole communities.

Chicago Philadelphia
School Closings 2013 47 23
Students Displaced 12,700 10,000
Layoffs 2,000 3,700
Charter Schools opened 15 9

The Chicago Tribune has an excellent map that illustrates some of social and economic dimensions of neighborhoods affected by the closures. Since, I’m very much in favor of visualizing data for my statistics-adverse students, I’ve decided to make my own map in Google Fusion Tables to help me with my lesson plan in the fall. I can always use Social Explorer, but it’s also useful and fun for me go through the effort of downloading U.S. Census data and making my own map.

The below is a color coded map of census tracts based on the percent of those with high school diplomas or higher based. The purple flags are where the schools closed in 2013 are located.

[Click for Map w/ Race & Income]

In particular, the consequences for school closures have dramatically affected communities of color. The Root reports that while African-American Students represent 58% of the students in Philadelphia, they made up 81% of the students affected by the closures. In Chicago, black students account for 43% of all students, but 87 of those affected. In this map, I’ve set it up so that you can toggle layers to look at race, income, and education attainment, so that you can see the connection between race and school closures. Setting up the toggle was fun it required playing around with JavaScript. For more simple layered maps, I use the Fusion Tables Layer Wizard. However, I wanted to create something that was more interactive that students could play around with. This required trying to find a color scheme for the maps so that when you toggle layers, they interact with one another in a way that is visually informative.

I’ll continue to work on this throughout the summer, but I wanted to blog on how summer “prep” work isn’t just revising lectures and reading. It can be an opportunity to develop other skills.

Summer Writing

handwritingIts summer time, which means I can get a lot of work done without the distraction of student emails, service work, and other things that take my attention away from research. So I’ve decided to devote this entry to my writing regimen.

In an Inside Higher Ed article, Hollis Phelps discussed how he’s been able to continue doing research at a teaching focused institution. While a very positive piece, many of the commentators below the article had harsh words for him, claiming impossible workloads as a barrier to getting writing done. The reality is scholarly writing is difficult and graduate school is generally a poor training ground for it. So, in the last year, a few people have asked how I’ve managed to publish while teaching a 4/4 load with no TA support. Or how I can write, teach, grade, and be involved without a 60 hour work week? So, I’ve decided to write this blog post on my writing process.

First, I think it’s important to get a few things out-of-the-way. I’m privileged to have a tenure track job. I have a PhD adviser and other colleagues to co-publish with. This either isn’t the case for those in fields where co-authorship is less common. Also, having a spouse that’s a graduate student in a social science field helps. I have ready access to a proofreader. I’m also lucky in that I teach courses related to my research. In other words, I’m privileged to have resources and be in a situation that others are not.

It also helps to have a writing strategy. When I was working on my second comprehensive exam (area paper) in graduate school, I realized that reading and writing at odd hours was not working for me. I also couldn’t wait for inspiration to hit me. The reality is scholarly work is my job, and I should treat it as such. Every moment in front of the computer should be productive. Of course, this is all easier said than done, so these are my 5 strategies for staying on task when writing:

  1. Know Thyself. It’s important to know what works and doesn’t work for you. I tend to write better before sunset. I also tend to work best if I devote 2-3 hours a day solely to new writing. I tend to write less junk that requires a lot of revision if I work while in that zone. So once my time is up, I move on to other work (like revision, course prep, reading, etc). Finally, I write better in my office than at home. This was my discovery in graduate school, and I’ve stuck to it ever since.
  2. Organization (daily and annually). Once you know what works for you, you need to organizeyourselfaccordingly.
    • Daily. Take advantage of the time that you have. Every minute is valuable to me. I not only organize my day to optimize my writing time, but I keep my notes, files, and references organized. It’s completely ridiculous to not use citation management software like EndNote and Zotero! I also organize my day like a typical 9-5 job, this allows me have a routine that includes time to clear my head when I get home from work (see below). In other words, being organized helps me balance work and leisure – both of which are important.
    • Annually. I don’t have a 60 hour work week because I work all year round. Summers are when I do 90% of my course prep for the next academic year. This saves me a lot of stress during the academic year. It’s also when I’m able to have distraction-free writing time year round.
  3. Routine and Discipline. Writing is a craft. You have to keep working at. It’s also not easy. As mentioned above, I write best in the morning. If this means I need to wake up earlier to get an hour of writing in before my 8 or 9 am class, then I get up earlier. If I’m not traveling during the summer, I try to go my office 2-3 days a week (or more). Being disciplined about your routine helps you stayed organized, which in turn helps you have time for your life outside of academia.
  4. Clearing your head. Something that helps me stay focused for those 2-3 hour blocks of time is making sure I feel refreshed mentally. I do very little writing at home. This allows me to recharge my mind before re-opening that Word document again the next day. I also devote a lot of time to mindless pursuits like television and video games. During the summer when I have more time, I go to the gym a lot. I shut down the academic part of my brain when doing these things. This keeps me from burning out. Some people can breathe academic work 24-7. I can’t, so I don’t.
  5. Learning to let go. I have way too many friends and colleagues who hold back their work. They think that an extra month of revision will help them perfect their work, and this ends up being month after month of delays. Part of knowing thyself is knowing that you’ve done all that you can on the manuscript (such as editing, proofreading, double checking sources and data, sharing with colleagues, etc.). Once you’ve done all you can, it’s in the hands of editors and referees (or advisers and committee members). The reality is that the peer review process inevitably yields some sort of criticism you have to deal with or some other kind of revision. This means there’s a time where you have to let go and trust that you submitted the best work possible.

What I’ve written above is what’s worked for me the last decade or so. It might not work for you, but nonetheless it’s useful to learn how to work with your strengths and around your weaknesses.

Good luck reaching your summer writing goals.

Thinking About Summer Reading

Splatter Reading

ReadingAs we approach summer, many of my professor and teacher friends are posting on their summer reading plans. Also, several of my friends have been posting this piece on reclaiming reading for leisure and enlightenment via Facebook. In many ways, all of this echoes the things that Neil Gaiman has said about reading. Essentially, that reading fiction for leisure is good. I agree. I also don’t think people (and especially young people) read enough. However, I want to offer my own very different personal trajectory as a reader and suggest that we all read for different reasons. Also, I’d like to argue that we all read for different things as well and that we shouldn’t idealize certain approaches to reading.

This past winter, while staying at my parent’s house, I showed Hande my writing assignments from grades 5 to 10. In that folder, there were papers on Constantine the Great, Lord of the Flies, Shakespeare’s plays, the American Civil War, To Kill a Mockingbird, the history of Iraq, and nuclear power. She remarked it was very clear I was meant to be a social scientist as my English assignments weren’t nearly as good as my “social studies” papers. In response, I said that I never liked “literature” anyway. My comment that day wasn’t completely true. I grew up reading a lot. My family had a set of abridged version classics such as Moby Dick, several works of Dickens, Mutiny on the Bounty, Black Beauty, and the work of Mark Twain that I read while in elementary school and junior high. I also read fantasy novels and had a love for Greek mythology. I remember enjoying The Great Brain series of books. Yet, it felt easy for my say that I didn’t like “literature.”

As literature lover, Hande was horrified by my response. She demanded that I never say such a horrible thing again. I reacted by re-igniting our longstanding argument over Catcher in the Rye. I hated the book and still consider it a waste of $8 (I read it for the first time 8 years ago on a boat ride from Turkey to Italy). She loved the book and we’ve been arguing about this for years. I’ve only recently come to understand the reason for this disagreement. We read books differently. She likes the characters – Holden, his teacher and sister Phoebe. However, the Catcher in the Rye has none of the things I look for in book – history, politics and details of social life/structure.

As a kid reading the abridged version of Oliver Twist or even watching the musical Oliver! I don’t think I ever thought much of the characters. Today, the characters are a blur. What stood out and continues to stands out to me were the conditions that the characters lived in. Orphanages and workhouses stand out in my memory more than individual characters. As I reflect upon the many books I’ve read, in general it’s not the characters or even story I remember. In Moby Dick, I was more fascinated by whaling more than with the characters. I remember harpoons and blubber, not Ahab’s obsession. In The Great Brain series, I was most interested in the technicalities of toilets being installed in the “frontier” West. The practical economic realities of collecting money from a fountain to live in a museum is one of the few things I still remember in the From the Mixed-Up Files of Mrs. Basil E. Frankweiler. I don’t even remember why the kids were in the museum.

There’s magic in reading. However, for me the magic was never found in larger than life characters or the idea of adventure and fantasy. The magic for me was being able to see the past come alive, or how society worked. Basically, as a teen, I was reading as a social scientist. I wasn’t interested allegory, symbolism, and the things that most people celebrate when they discuss the joys of reading. I’m not interested in dreaming with open eyes. Rather, when I read fiction, I am searching for nonfiction in those texts. In other words, I disagree with Neil Gaiman’s statement that “reading fiction, that reading for pleasure, is one of the most important things one can do.” I disagree with Gaiman’s assertion that fiction has a special place in activating our imaginations. While, I agree that fiction can be a gateway drug to reading, it doesn’t mean that nonfiction can’t inspire us.

We all read for different reasons, and we all read for different things. Today, I don’t read a lot of fiction. The last novel I read for fun was A Game of Thrones, and I believe prior to that might have been Philip K. Dick’s A Scanner Darkly and before that Nick Hornby’s A Long Way Down (over a span of 5-6 years). There might be some Dan Brown in there also. However, I enjoy reading nonfiction more than fiction. I know I enjoyed SuperFreakonomics more than any other recently read fiction

In conclusion, I don’t think people read enough. As an educator, I believe reading books is important. However, I don’t believe in the idealized myth of what reading is supposed to be like – reading a physical paperback novel and daydreaming. Reading nonfiction on an e-ink Kindle is still reading. It might be a different experience, but it can still inspire and provoke deep thought.

My reading list this summer consists of:

  1. Finishing my friend Jeff Howison’s book on Reagan.
  2. Bourdieu’s Distinction
  3. Robert Sampson’s Great American City

Happy Reading Everyone

They are not the same: MLA versus APA (or ASA)

Splatter Checksheet

checksheetIn my last post, I talked a bit about social science writing. Although I am trained as a sociologist, my work is interdisciplinary. My work draws on art history, cultural studies, geography, history, and media studies. As such, I often have to adjust my writing and reference style for different journals. In some cases, I’ve actually chosen not to submit my work to journals because it would require a massive revision of my work to change it from a social science style (APA, ASA, etc.) to MLA. This is one of the reasons why I cringe when someone says that all citation styles are the same. I think this is because most faculty simply refer to students to style guides that show the differences between MLA, APA and Chicago, but do not explain why the styles are different.

In this post, I want to highlight the key differences between MLA and social science references and try to explain why they’re different. First, of all I don’t want get into the difference between nomothetic social sciences and idiographic humanities. I’m more interested in the actual technical difference of citation and the function they serve. My goal is to use examples to show readers that there’s a reason the styles are different.

I’ve chosen an article from PMLA, the Modern Language Association’s flagship journal. Also, I’ve chosen American Sociological Review (ASR) an American Sociological Association (ASA) journal (because I’m a sociologist). Both touch upon similar topics: prisons, incarceration and its consequences. However, the goals are different. In PMLA, Robert Waxler is telling a story about his program Changing Lives through Literature. In this piece, he discusses his experiences with teaching literature to criminal offenders, and discusses Nathaniel Hawthorne’s description of prisons. In ASR, Matthew Desmond and Nichol Valdez are discussing the rise of third-party policing in poor neighborhoods using empirical evidence.

MLA is a style that is very closely associated with the type of textual analysis found in the humanities. The way one references text in that style, is very much tied to the practices and goals of the fields that use it.  Waxler writes in the 2nd paragraph of his article:

Nathaniel Hawthorne had another idea. He offers three terms – community, cemetery, and prison: “The founders of a new colony, whatever Utopia of human virtue and happiness they might originally project, have invariably recognized it among their earlier practical necessities to allot a portion of the virgin soil as a cemetery, and another portion as the site of a prison” (47). We cannot escape the cemetery anymore than we can escape necessity, as Hawthorne well knew. It marks the boundary for us, the radical limitation, the body without voice or movement, the corpse. The prison reminds us of a difference, the possibility of return to the community, to the voice and movement of lives restored-the call to freedom, to possibility.

Here it’s very clear that Waxler is writing about Hawthorne. Moreover, his use of Hawthorne is to help him define Waxler’s own understanding of mortal, physical and social boundaries. When he references William Wordsworth in the following paragraph, it’s very clear that he is now talking about Wordsworth. In addition to naming names, it’s also far less common in work that uses MLA to pack in references. References such as: (Ayling, Grabosky, and Shearing 2009; Braithwaite 2000) found in Desmond and Valdez’s article are not commonly used in this type of writing.

Here is the introductory paragraph from an article by Matthew Desmond and Nichol Valdez:

The United States has witnessed a prison boom of colossal proportions, fueled in large part by intensive policing of inner-city neighborhoods (Western 2006). At the same time cities were hiring more police officers and states were building more prisons, another far-reaching development was unfolding within the field of criminal justice. Across the Anglophone world, crime control was becoming decentralized and diffused throughout the social space. The police began convincing and coercing community actors (landlords, business owners) to assume some responsibility for correcting misconduct. Identified by a number of designations—here, we use the term third-party policing—this approach constituted “a new crime control establishment” (Garland 2001:17). “The most significant development in the crime control field,” according to Garland (2001:170), “[is the development of] a third ‘governmental’ sector . . . poised between the state and civil society, connecting the criminal justice agencies with the activities of citizens, communities and corporations . . . [and extending] the field of ‘formal’ crime control and its potential for organized action.”

While both articles define the concepts they will be using via quotes and references, the style and function of the references are different. In the sociology journal, Western’s name and publication year is the reference.  Typically, in the text of an MLA paper, Bruce Western would already be referenced to show who came up with the idea. This means the reference in MLA is telling the reader where it came from. In ASR, the reference quickly tells us who and when the idea of the prison boom came from. The where, or the textual is absent unless one chooses to look it up. Even then, the writing suggests that we are not particularly interested in Bruce Western either. Rather, the goal is to quickly give attribution to Western’s research on the prison boom to set up factual information before moving on to David Garland’s discussion of control to explain third-party policing. In short, the references obviously provide the reader with different information. This means readers from different backgrounds expect different information.

I want to go a bit further and illustrate how different the first sentence would be if re-written as MLA.

According to David Western in “Punishment and Inequality in America,” the United States has witnessed a prison boom of colossal proportions, fueled in large part by intensive policing of inner-city neighborhoods.

This MLA version makes the prison boom as an offshoot of David Western’s work. However, what is Western’s work? Is it opinion or is research? Even if one where change the sentence to “According to research conducted by criminologist David Western…,” it still implies a degree of subjectivity because it emphasizes the author. Sometimes this is useful, but in many cases it is not. In the social and natural sciences, the reference and writing style emphasizes the research behind the statement (or at least that it is credible and reliable). On some level, it does not matter who came up with the idea, because another researcher should be able to replicate the result.

This barely scratches the surface of the differences between two very excellent pieces of writing. However, I hope this begins a discussion of why styles are different. Or at least move away from statements like “MLA and APA are pretty much the same thing.”

Before I conclude, I want to mention another thing. If Waxler had been a sociologist, his article could be considered unethical. Prisoners are classified as vulnerable subjects. The inclusion of quotes from those he worked with for in a publication without informed consent and human subject approval could mean trouble for him. There is no discussion of this in the paper at all, whereas in a social science article there would be a mention of this. This means that the process and final result of writing for the humanities and social sciences are as different as their reference styles.

Disciplinary Writing

I’m writing this as a rebuttal to my colleague Amanda’s blog post about writing. I fully understand the intent of her piece and appreciate the message she is trying to send to young writers. However, the idea that students should write from their soul troubles me greatly as a social science professor. The danger of telling young writers to come up with their own voice, is that they often interpret it as opinion or personal reflection in their papers. This is perhaps the greatest source of annoyance for social science faculty (and likely for those in the natural sciences as well). As someone who grades nearly 100 sociology papers a term, I am increasingly bothered by my students’ inability to write social science papers. They resort to MLA, because that’s how they’ve been taught for years. They extensively use metaphors and similes, because that’s how they learned to “show, not tell.” There are a number seniors who tell me that they’ve never written a research paper until they reached my class. Basically, my sociology colleagues and I need to (re)train our students in social science writing.

This does not just affect undergraduate students. Because high school writing and college composition is so heavily dominated by English departments, even graduate students often struggle to adapt to the norms and conventions of non-humanities fields. While Amanda is encouraging students to break the rules, I am arguing the opposite. Students need to learn the “rules” if they want to be taken seriously as social scientists. Duke University, for instance, has a guide to discipline-specific writing guide. Other discipline-specific writing resources can be found at the bottom of this post. I would argue that discipline-specific writing needs to be better integrated into K-12 and college curricula.

In most cases, writing is not simply about the author expressing their creativity. It is also about the audience. It is about communicating your ideas effectively to that audience. Different audiences expect different things. This is because different types of writing serve different purposes. The goal of creative writing is different than social science research writing. There are also different kinds of social science writing. Are you generating theory? Or reporting findings? Or is it a review of the literature? This all requires fundamentally different rhetorical strategies, and discipline (or even sub-discipline) specific writing. The strategy of “show, not tell,” is accomplished very differently in different fields. In order to effectively communicate ideas, the author must (reasonably) conform to the norms of the discipline.

Amanda emphasizes two things in her blog: voice and style.

I believe that ALL authors need to have a voice. However, different types of writing require different voices and styles. For example, ethnographers walk a tightrope where they need to ensure their voice does not overly impose their own subjectivity onto their “subjects” while still making their own argument. In some (not all) experimental and quantitative work, the author is often “reporting” results. It’s a matter-of-fact style in which procedure and results are front and center, not necessarily the author’s voice. Typically, the method chosen reflects the different goals and interests of the researcher, and in turn shape the writing. In fact, I would argue that voice, structure and style is very much tied to research method. The type of writing associated with different research methods has largely evolved out of the rhetorical needs of researchers to effectively make arguments, legitimize their work, establish credibility and make reliable claims. To deviate from convention is not just a risk, but poor social science writing. In some cases, it might even be considered unethical.

In conclusion, I want to offer different advice. It is actually a bit of advice that’s cobbled together from several professors I had in graduate school: Study the “type” of work published where you want to publish. Study the style and language of what you enjoy reading. In other words, learn to write like the authors you read. This does not mean give up on creativity. It means using successful examples of writing as a model for your own success.

Discipline Specific Writing Resources:

Adding Visualization to Your Course

Visualization, or more specifically data visualization, is currently a major trend in communicating information in business, news media, and increasingly academic research and teaching. A 2013 white paper produced by the Intel IT Center, notes how visualization-based data discovery tools can aid businesses analyze, interpret and present data. In 2014, Wired Magazine noted the relationship between data and visualization for a variety of different purposes from policy research to augmenting news articles on NASA programs and projects.  An article in the journal Visual Studies (associated with the International Visual Sociology Association) discusses the different applications of data/information visualization for humanities and social science research.

While data has always been visual, perhaps the most significant software package that made visualization “easy” at work and in school is the release of Microsoft Office in 1990. For almost a quarter century, PowerPoint has dominated how we think about visually presenting information. A fantastic thing that PowerPoint does, which too few people make use of, is importing or create from scratch charts and tables from Excel. This allows for a more visually appealing (and more legitimate) presentation, than if you were to download an image from online, or use a scanned image from your textbook.

However, PowerPoint is not without challenges. While PowerPoint and its integration with Word and Excel makes for excellent in-class presentations of visual information, it is not particularly good online without the help of Adobe Presenter or Camtasia to turn the PowerPoint into a “screencast.” There are cloud based solutions such Google Docs, Office 365 and Prezi that can make presentations animated and clickable in an online environment.

In the world of the Internet, concise and visually appealing graphics are king. This is why infographics are very popular online.  As the name suggests, they graphically represent information, data or knowledge quickly and clearly. There is no single type of infographic. It could be a chart, map or timeline. It could be a word cloud. Sometimes a well-designed infographic is better than a PowerPoint. There are a number of online tools that can help you create an infographic.

Infographic Tools

The above links allow to create either static images or embeddable infographics that summarizes a lot of information. It can contain a combination of text, charts, maps, and other images that communicate a point or idea with (hopefully) hard data.

It is important to recognize that web-based infographic need not be the only way in which you visualize information. There are a number of useful tools, applications, and scripts that can make the way in which you present information online aesthetically appealing, dynamic, and interactive. Moreover, this can be just as useful in person or online. It can also be an additional resource that is posted on D2L.

Timelines

Timelines can help you organize information chronologically. Dipity is an easy tool for creating a timeline. If you are building a webpage or site outside of Desire2Learn, I personally like TimelineJS. Specifically, I like it because of how it uses Google Docs. Because it uses JavaScript, it will not work on D2L. However, if you are using WordPress on your own site, there are TimelineJS plugins that allow you to easily embed it into pages and posts.

Maps

In addition to organizing information temporally, there’s also the spatial aspect of information. I’m a big fan of Google Fusion Tables. It allows you to upload an Excel file with addresses or other geographic information to create different maps. If you don’t have a Google Docs account or want to simplify the process, then I recommend BatchGeo.

Words

For those of you interested in content analysis, you can create a word cloud to visualize word frequency in a website or document, or chart the historical usage of a phrase through history. These word clouds can be dynamic and visually interesting. For instance Tagxedoand Wordle can highlight popular or commonly used words in a website or document. Google has their Ngrams viewer for Google Books. This allows you to see how often various words or phrases appear in books throughout time. In addition to content analysis, there are a number of tools that allow you to see what is “trending” right on the Internet or how various idea are interconnected. Google Trends lets you see what is being searched. While,TwitterSpectrum allows you to look at relationships between trending tweets. Finally, Wiki Mind Map lets you look at how various terms, ideas, or concepts are connected on Wikipedia.

Advanced Charts

For those of you who are more ambitious, you may want to create your own dynamic webpage or content file from scratch. Probably, the easiest way to include interactive charts and data tools for is Google Docs and the many products from Google Labs/Developers.

However, if you have space and time, there are some really neat things that you can do. For instance, you can upload an Excel spreadsheet to Google Docs and use Google Charts to create an aesthetically appealing and interactive chart for your website. For pre-existing charts, you can browse Google’s Public Data Explorer.

If you do not want to use Google Docs, IBM’s Many Eyes does essentially the same thing without requiring an account. In addition to the material on Many Eyes, Better World Fluxhas beautiful and socially relevant data for social scientists.

For those of you with a bit more web development experience, here are two jQuery Chart Libraries to make an interactive chart for your website.

Conclusion

This is by no means an exhaustive description or listing of resources for visualizing information. However, I do believe the existence of different types of infographics and visualizations reveal the ever changing relationship between visual culture and knowledge. This is a change that I believe educators need to be sensitive of as we engage 21st century learners.

Originally published on KU Converge: A Journal of Faculty Collaboration for Distance Education